Spyglass Slicer Color Tables
Hello and welcome to my ramblings about an old 3D modeling program, or more specifically its color visualization for a range of values.
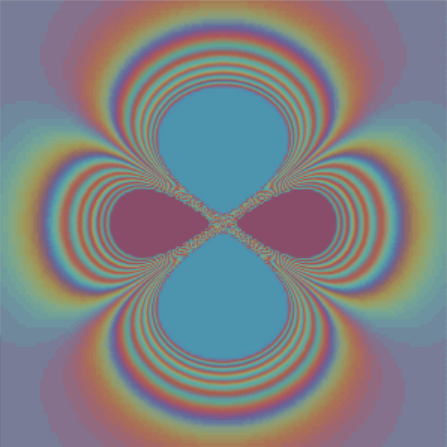
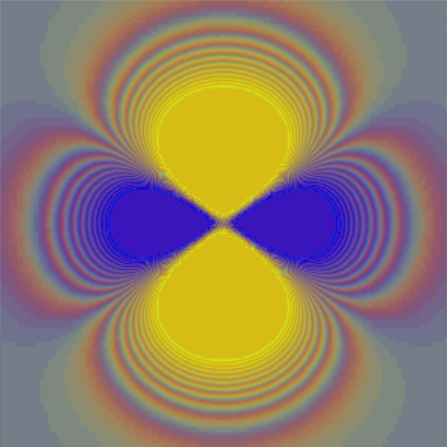
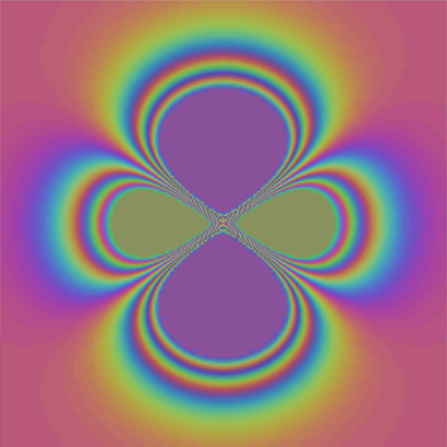
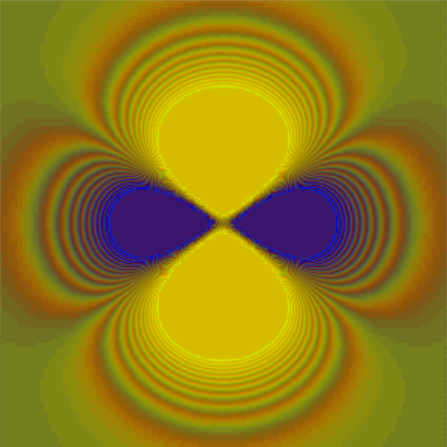
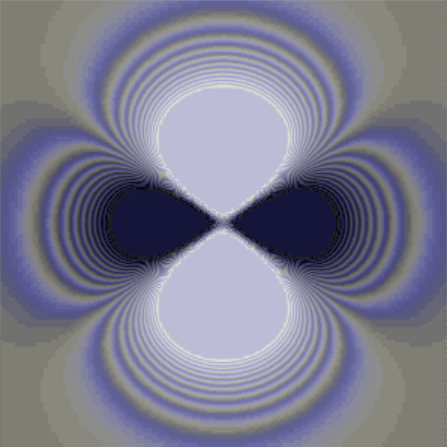
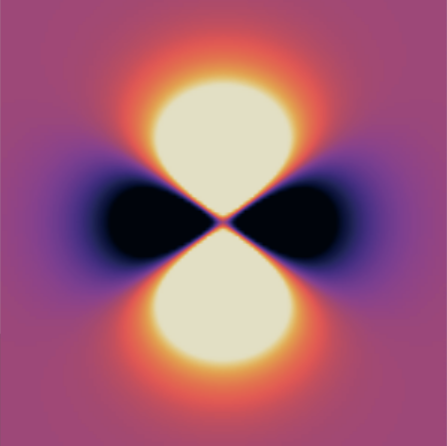
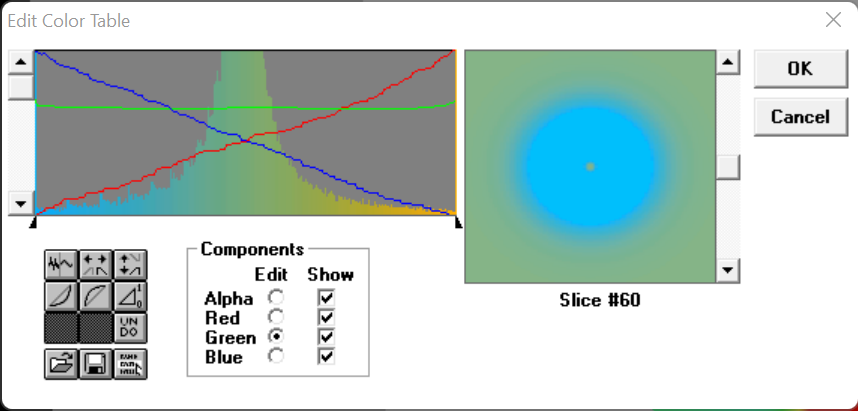
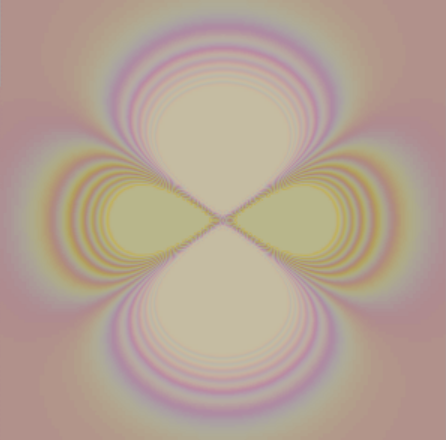
Above are some of my custom color tables modeled by a slice of a 3dz2 orbital.
Index
- Background - Orbitals (the subject being modeled)
- Spyglass Slicer - Download and use the 3D modeling program
- Color Tables - How to make color schemes for slicer
Background
Orbitals are pockets of space where an electron around an atom's nucleus is most likely to be found. One orbital can contain up to two electrons.
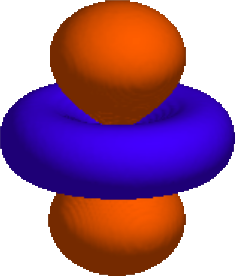
Here is a 3D model of a 3dz2 orbital, shown by using a positive isosurface (orange) and a negative isosurface (blue). The negative and positive values don't refer to charge, but rather if the wave of the electron is "up" or "down" relative to another electron (important for wave interferance)
In my physical chemistry class we did some complex math I cannot even begin to remember, much less explain, but we used said math to produce data that we then used to model orbitals! (I love orbitals). Our data not only maps out an outer surface of an orbital (not that there truely is one) but also all throughout! Meaning we can take a "slice" (a 2D plane) of our 3D orbital, and see the distribution of probability. Zero means there is no likelyhood an electron is there, so the higher the absolute value (regardless of positive or negative sign) the more likeley the electron is to be there
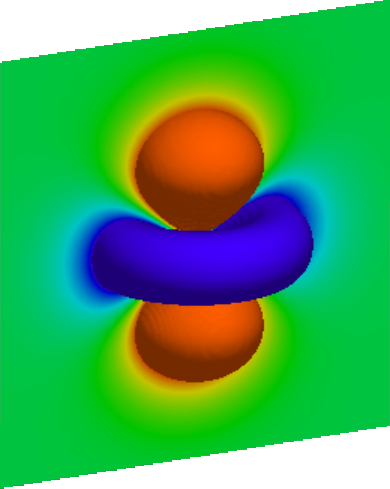
Here we see a plane intersecting an arbitrary surface of the orbital. Green symbolizes zero, and both red and purple are the highest probability (red being positive and purple being negative).
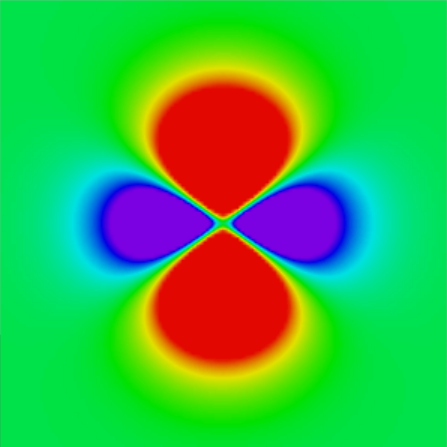
Heres the plane without the surface. This plane allows us to see distinct "nodes" of the orbital, where electrons are most likely to be found, and barriers separating these nodes where electrons are least likely to be found. Note that the green (zero probability) surrounding the nodes is not exactly zero; there still is a very small chance of finding an electron there (hence why there is no real defined outer surface).
To model these orbitals, we used an old program called Spyglass Slicer!
Using Spyglass Slicer
Free Download!
To download Spyglass Slicer and some orbitals/spheres/color tables, click this link to download a zip file: Spyglass Slicer.
Also included is a text file guiding you on how to open each orbital/sphere file with the correct settings and dimensions. Have fun!
How to open a file
After you've unzipped the folder and open "SLICER.EXE" you will see the following window:
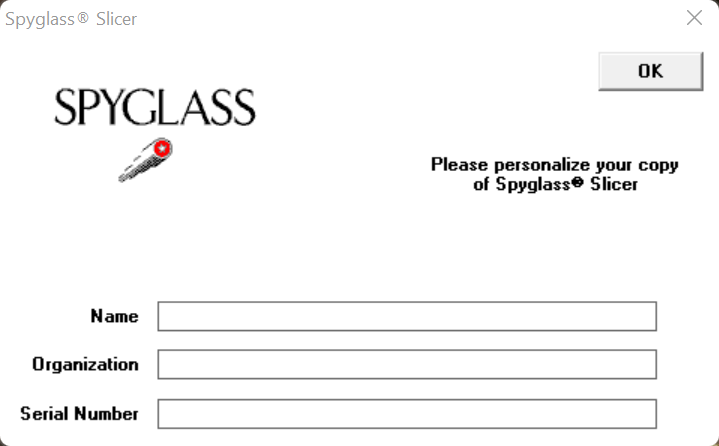
You don't need to enter any information, just click the OK button
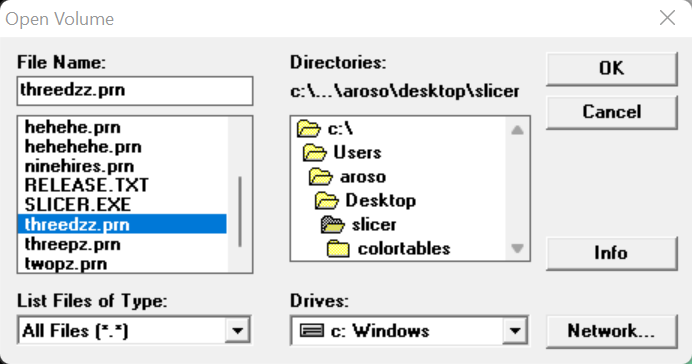
You will want to choose a .prn file so under the "List Files of Type:" dropdown choose "All Files" (at the bottom), then select one of the .prn files under the "File Name" section. Click OK.
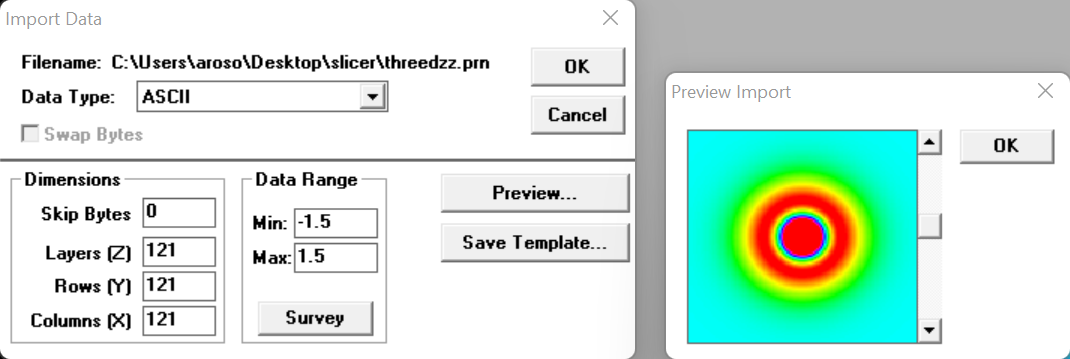
Next to "Data Type" select "ACSII". You will also need to enter the dimensions and data range. These are different for each file, so from the slicer folder you can open my "prn_file_guide.txt" in a text editor to see the parameters for each .prn file. Or you can view the same document here:
How to view a slice
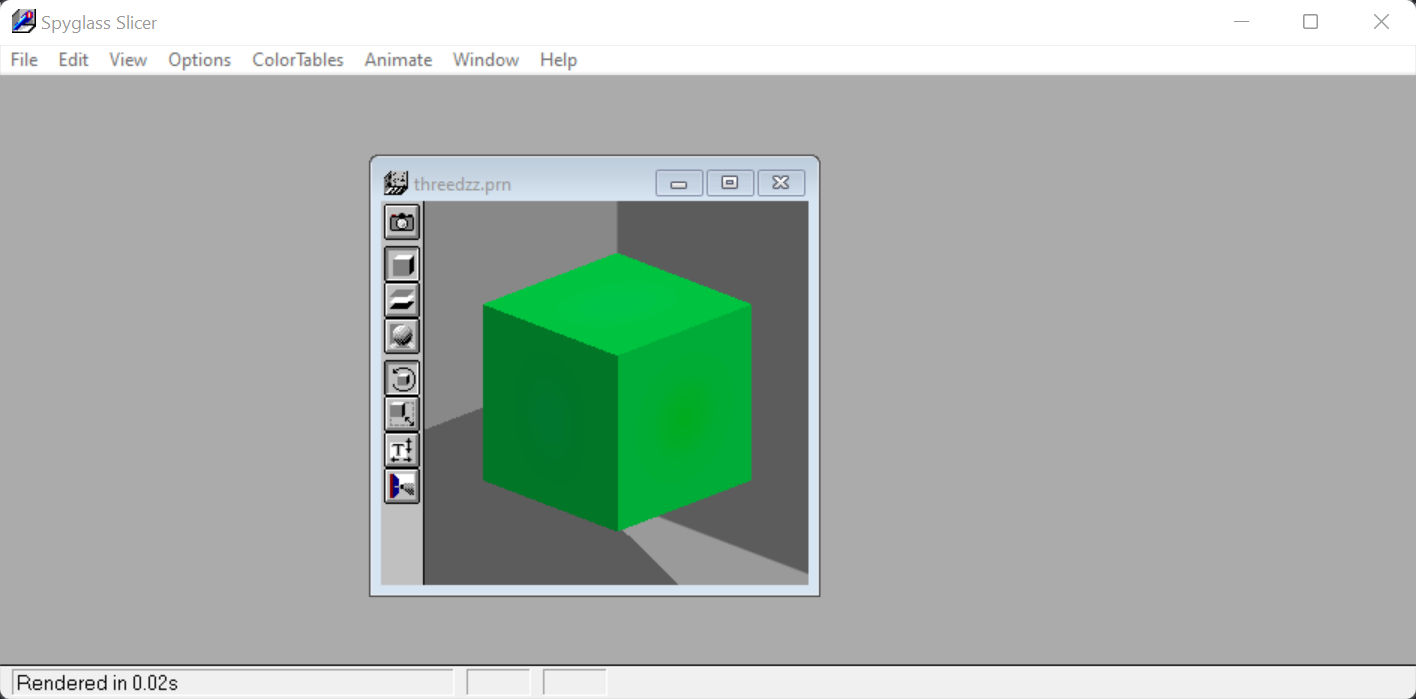
This screen shows when you open your file (cube may be a different color depending on the file). Feel free to maximize the program window and file window.
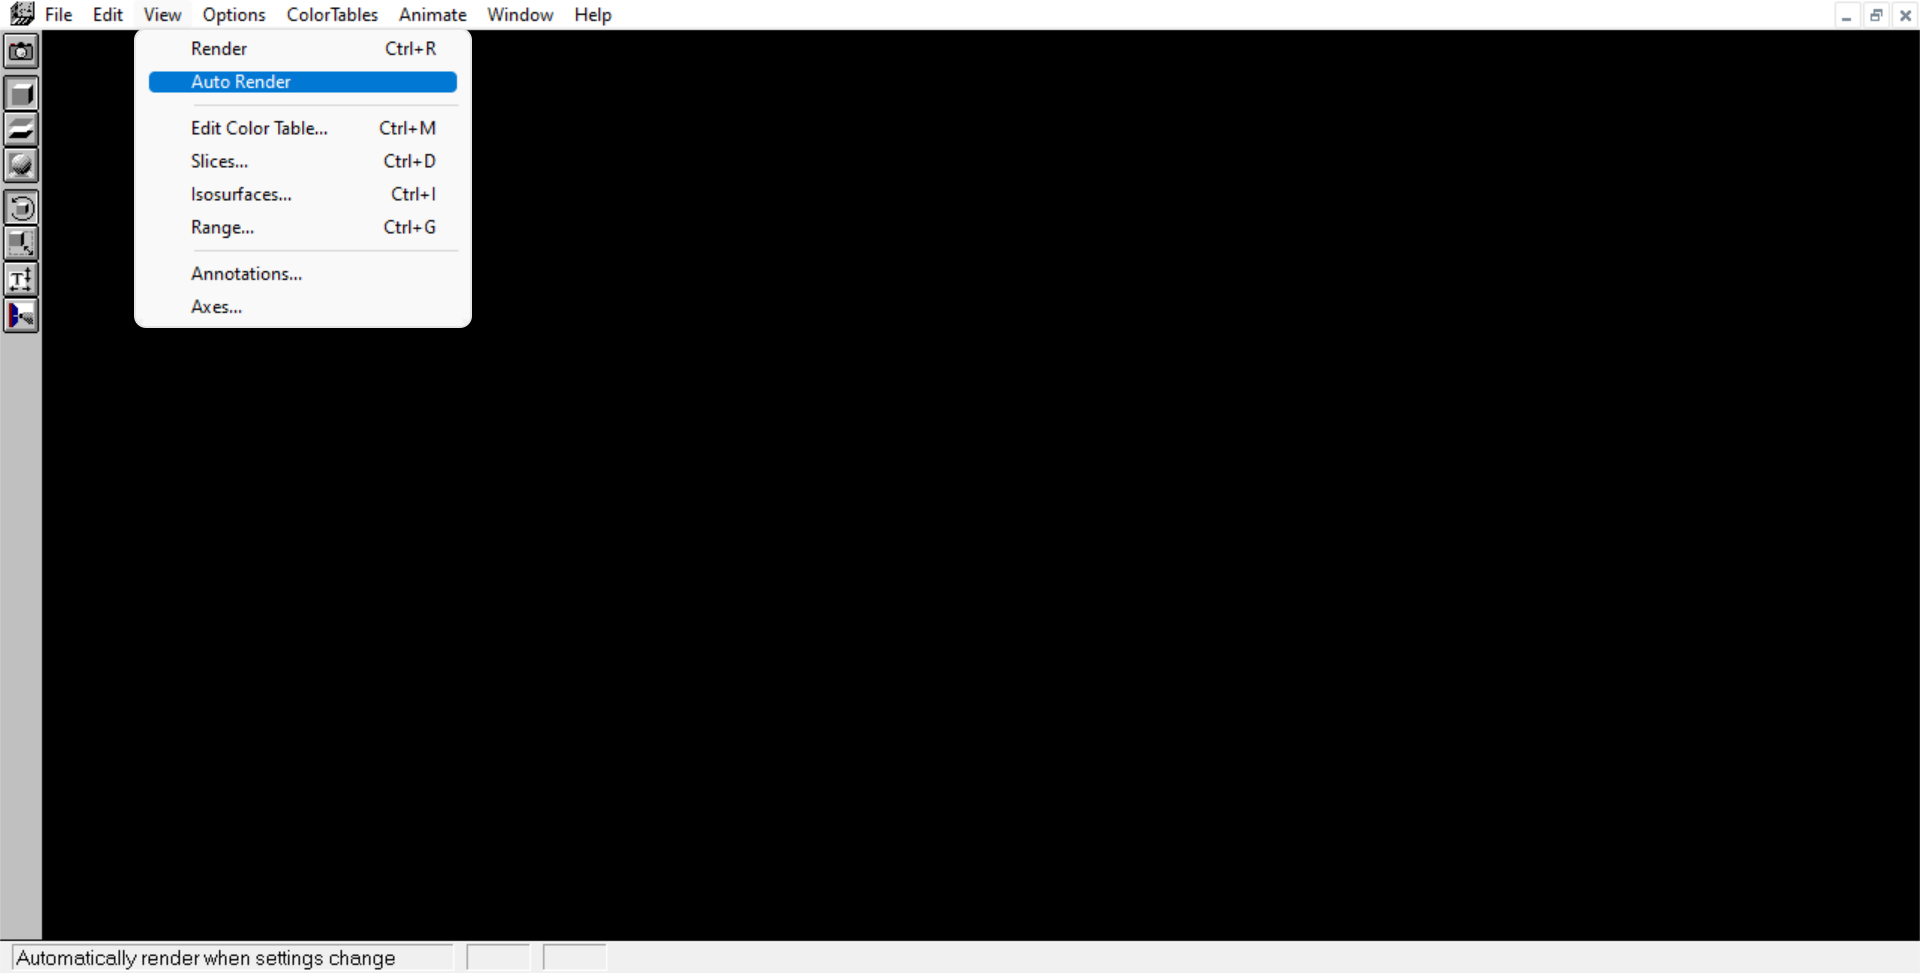
You will want to turn on auto render, otherwise you will have to manually click render everytime you change something
View > Auto Render
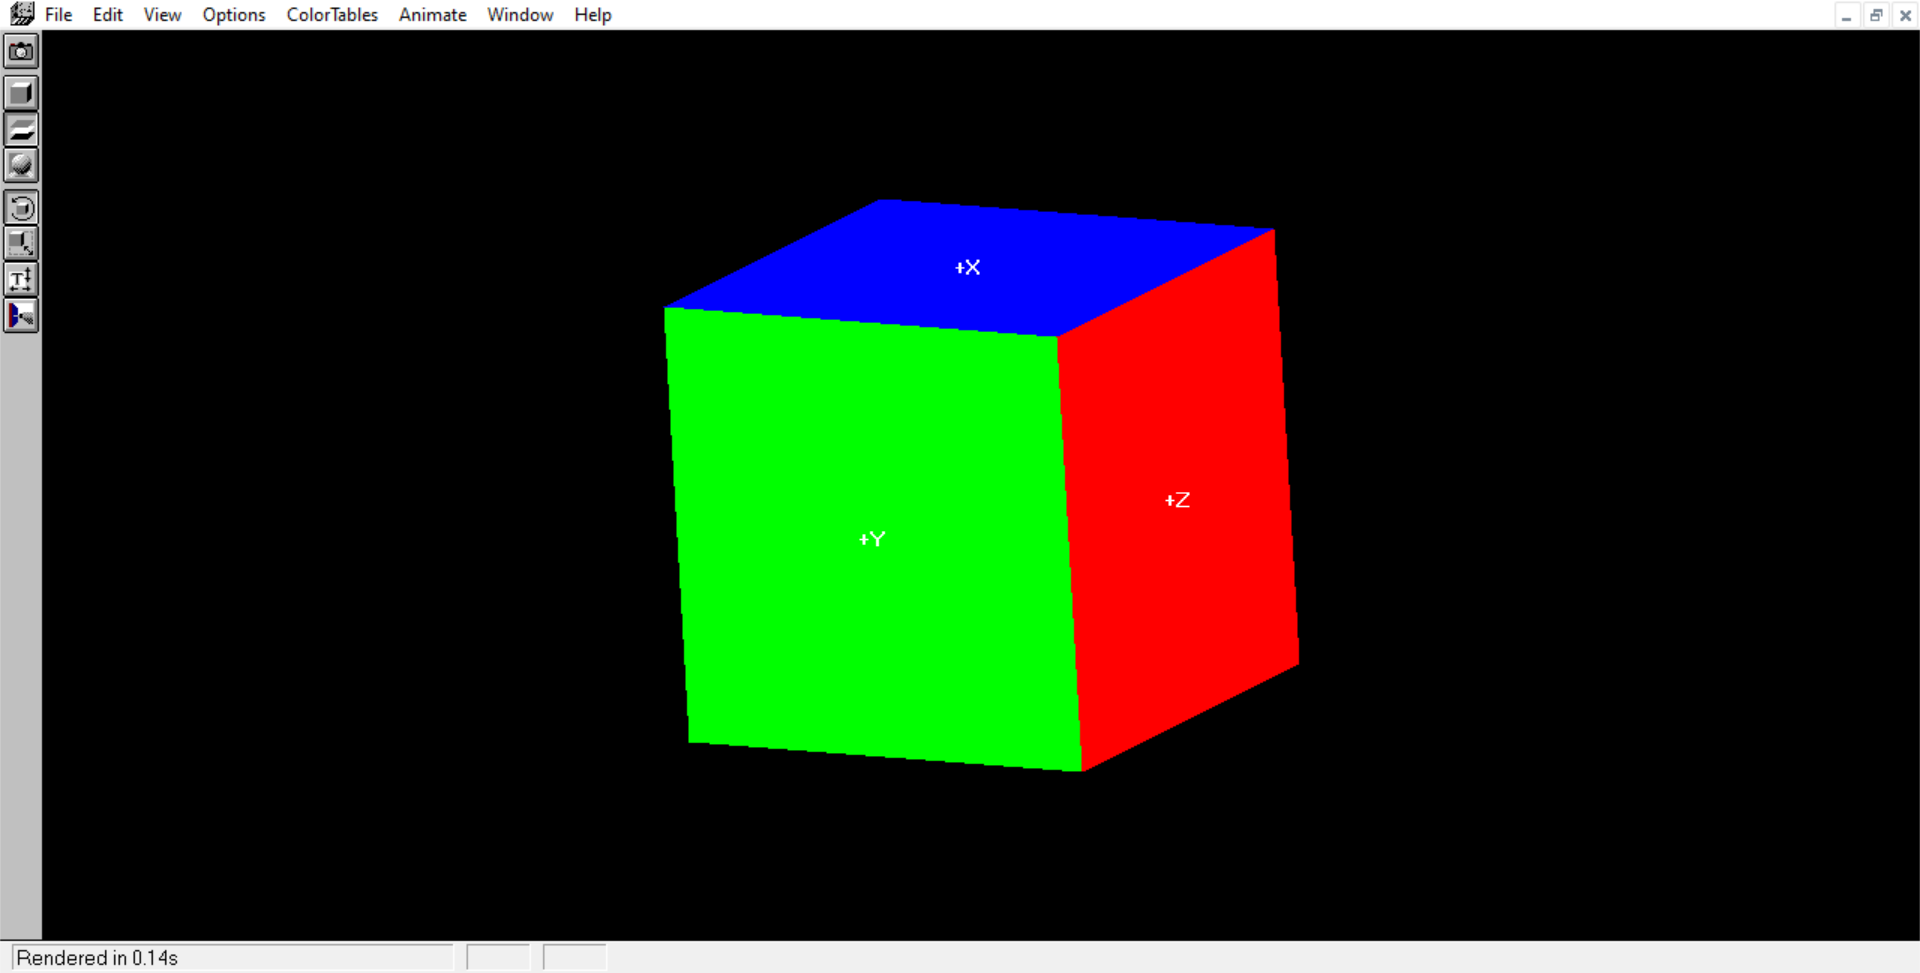
Click and hold down as you move your mouse to rotate the shape. As you rotate, your screen will show an RGB cube like this one until you let go.
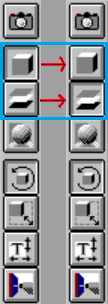
To see a slice you first need to turn off the box button (under the camera) and turn on the layer button. However nothing will change until you make a slice
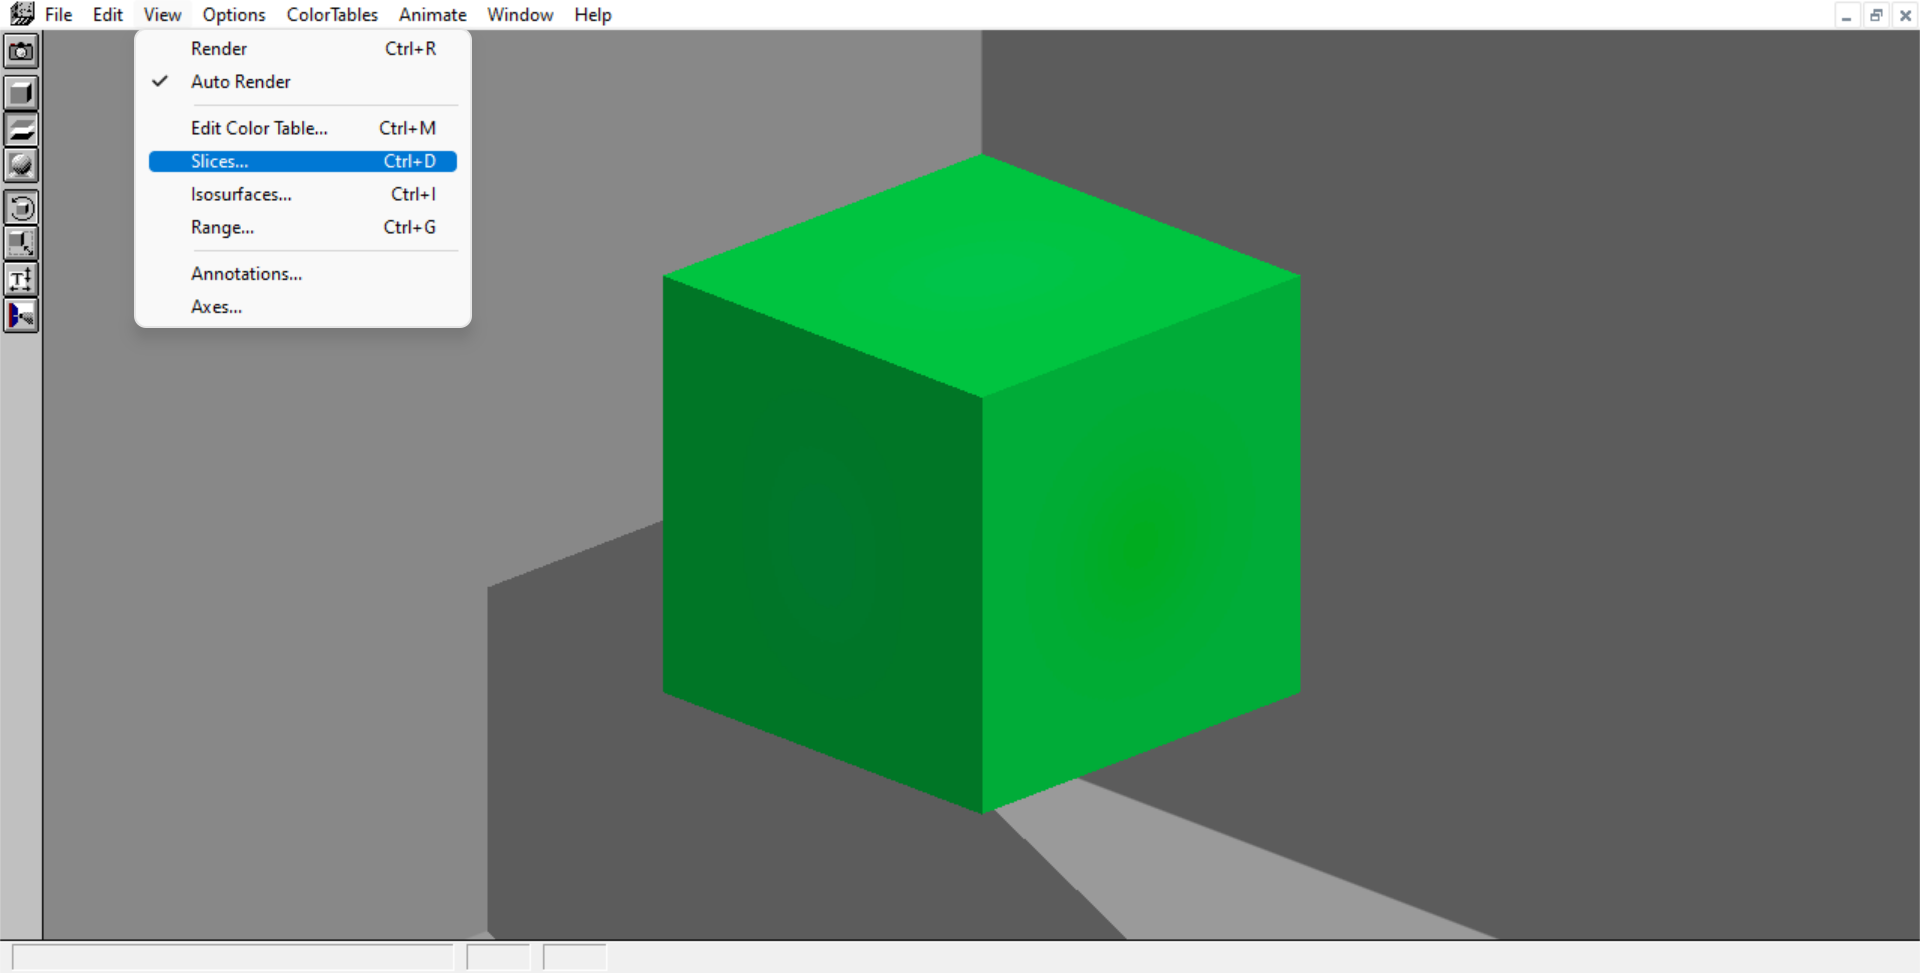
View > Slices
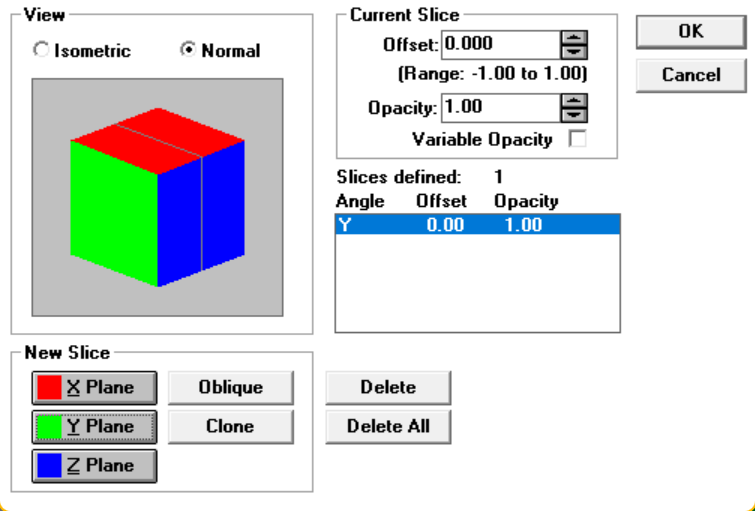
Click one of the buttons under "New Slice"! Multiple slices can be displayed
Color Tables
How to make color table
Now that you can actually make a slice, we can talk about color tables!
A color table is a gradient of colors, spanning over the data range of an object being modeled. One color is at the maximum data value, one color is at the minimum, and any number of colors can lie between.
The slice below shows the default color table; a saturated rainbow, where purple is the min value and red is the max (with the other colors inbetween). There are a variety of other preset color tables, but you can also make your own!
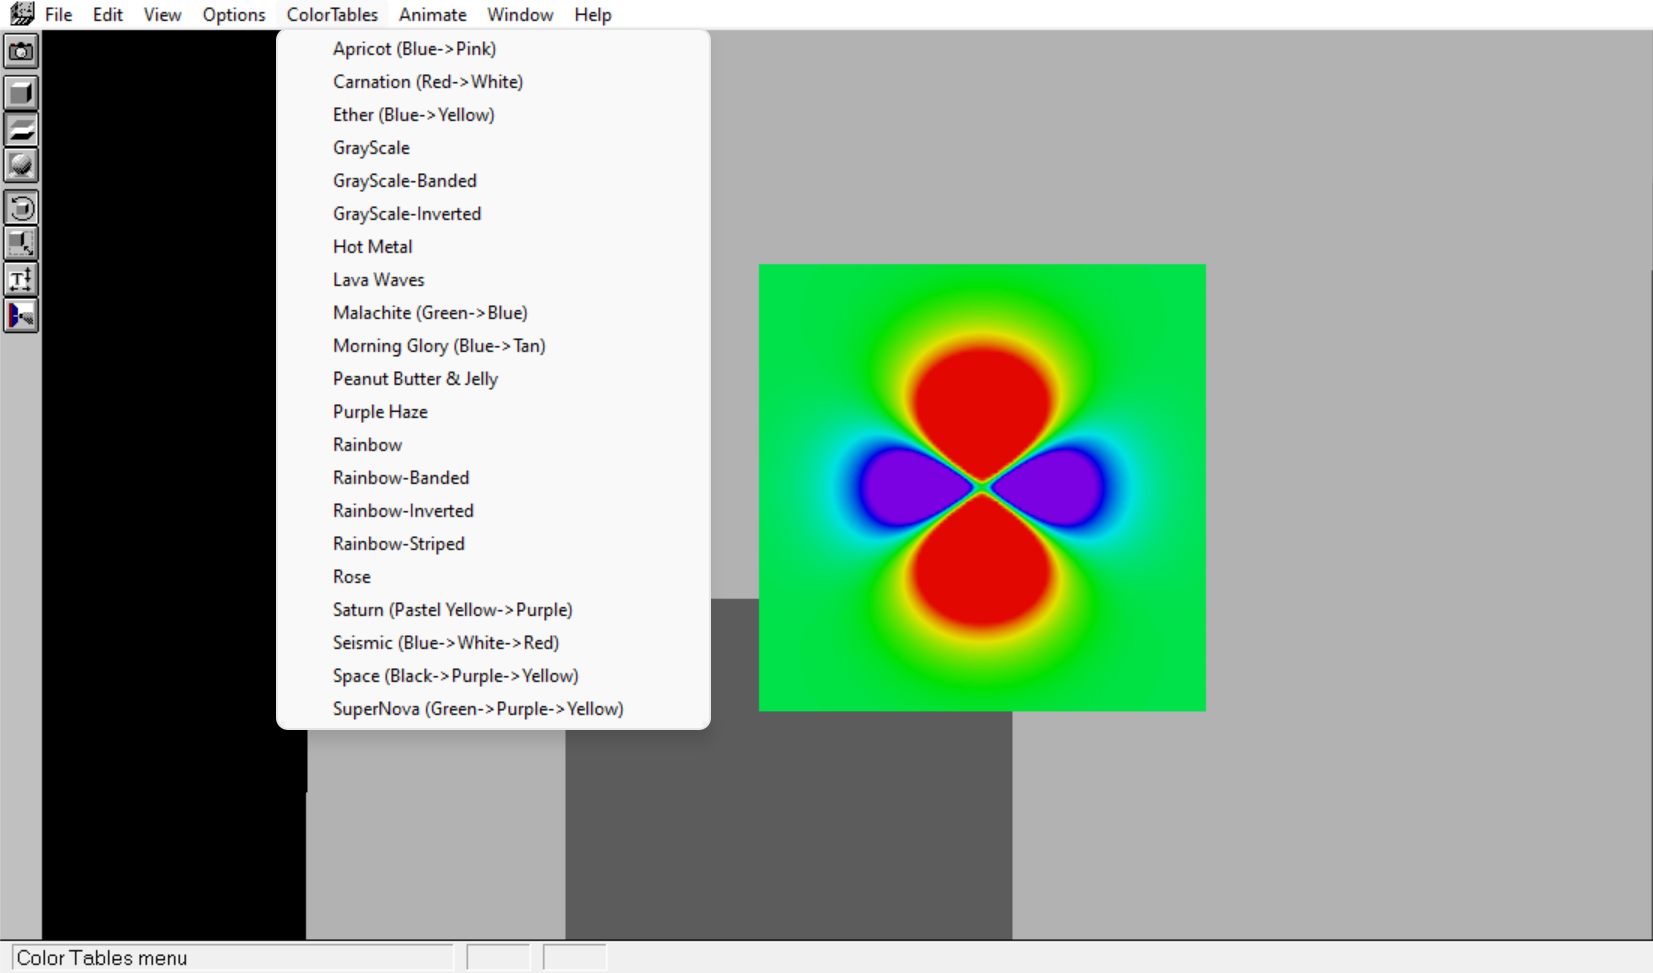
Heres the list of preset color tables (conveniently under the "ColorTables" button up top), try them out!
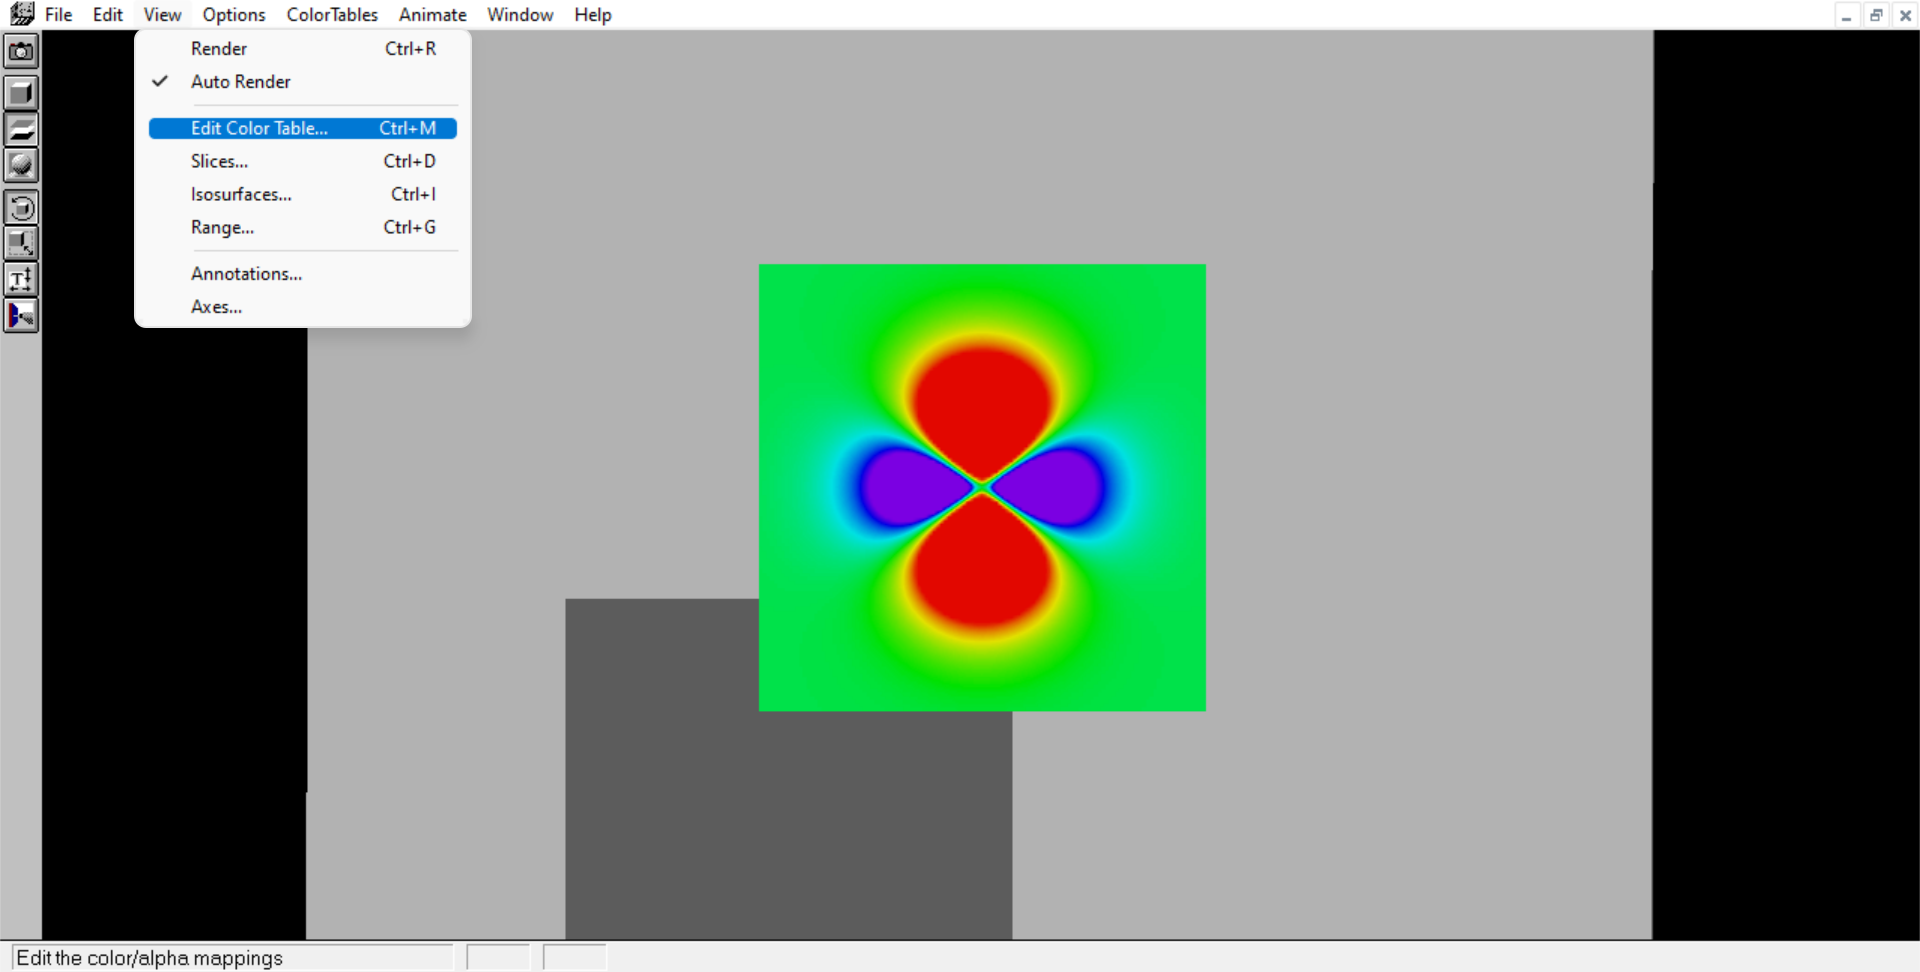
Go to View > Edit Color Table... to customize the selected color table
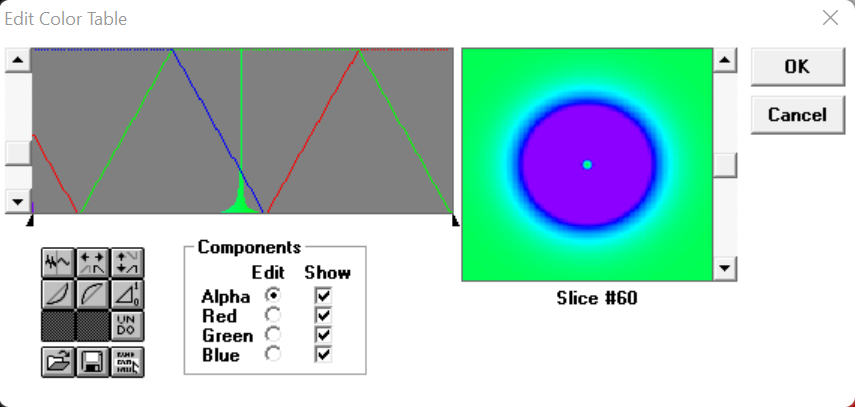
Here is the edit screen for the default rainbow color table! Each color channel can be editted (red, green, and blue) to create a gradient of colors. The middle intersection where red and blue reach the very bottom, and green is up top, creates a pure green color. Far left has no green, full blue, and half red, creating purple. Far right has no green, no blue, and full red, creating pure red. Where red and green overlap, is a gradient of lime, yellow, and orange. Where blue and green overlap is a range of turquiose
Lets get a little more simple:
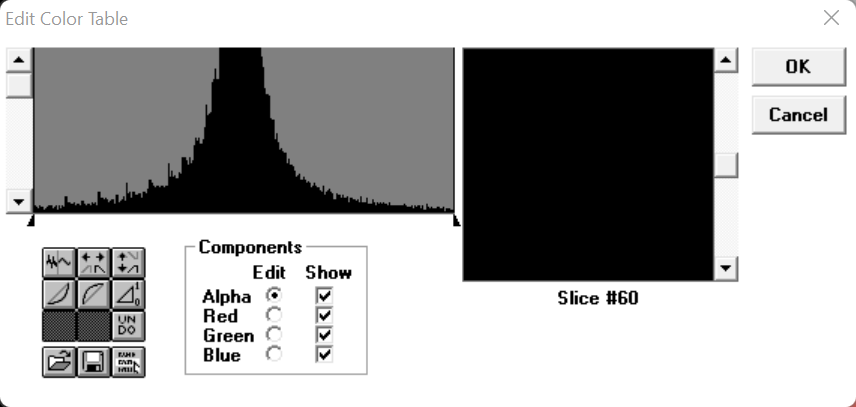
Here I put each color channel at the bottom, making black. To change a color, click the button next to it, and click and hold to draw a path on the data box in the top left. Top is most saturated, bottom is no color. Left most is the minimum, right most is the maxium.
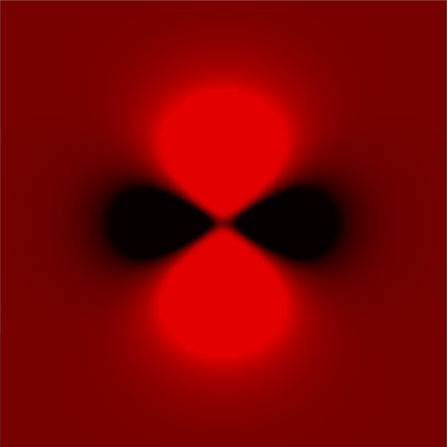
Here I drew a red line so that the minimum is black and the max is red (zero is dark red).
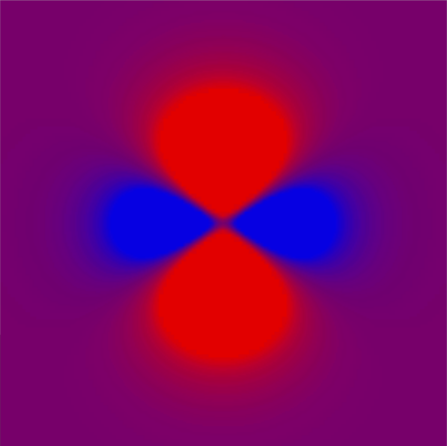
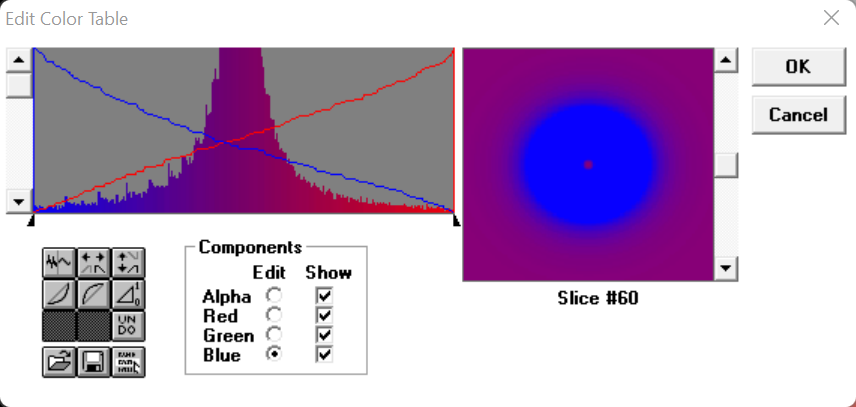
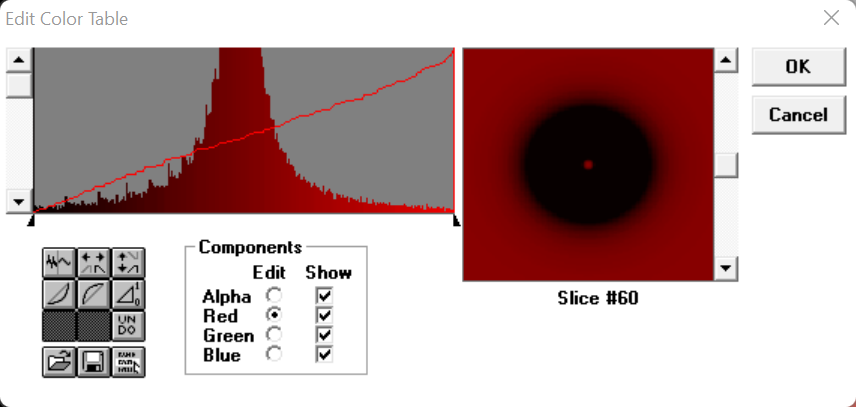
I drew a blue line the opposite way, creating a blue red gradient
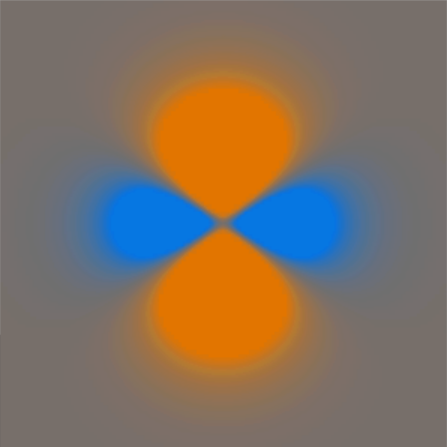
Heres a green line along the middle, making the blue closer to turquiose, and the red orange. The middle is grey because all of the colors are at the same height, neutralizing each other.

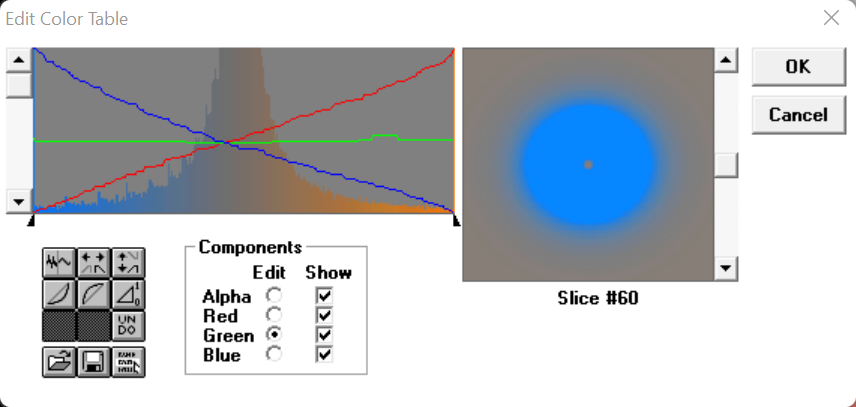
This is very similar to the last, but the green line is higher, making the gradient overall greener.
Click the save button on the bottom row of the buttons to save your color table!
To open up a color table you have saved, click the open folder button next to the save button. You will probably have to select "All Files" under the dropdown as "All Color Tables" does not bring them up. Note that your own color tables will not show up under the "ColorTables" on the main screen, you have to go to View > Edit Color Table first
My color tables
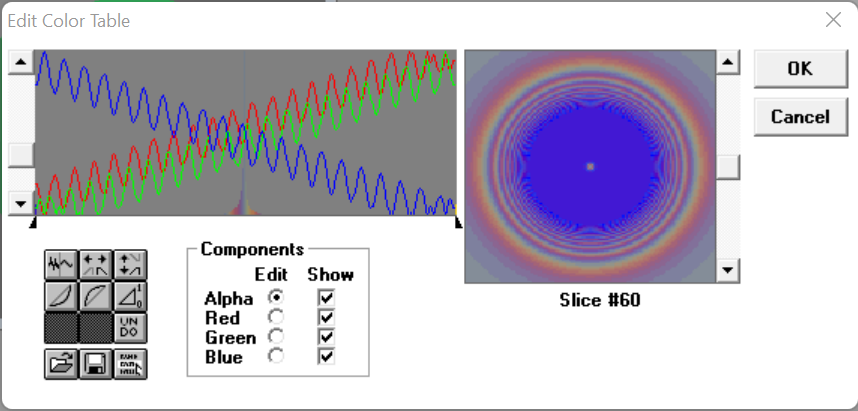
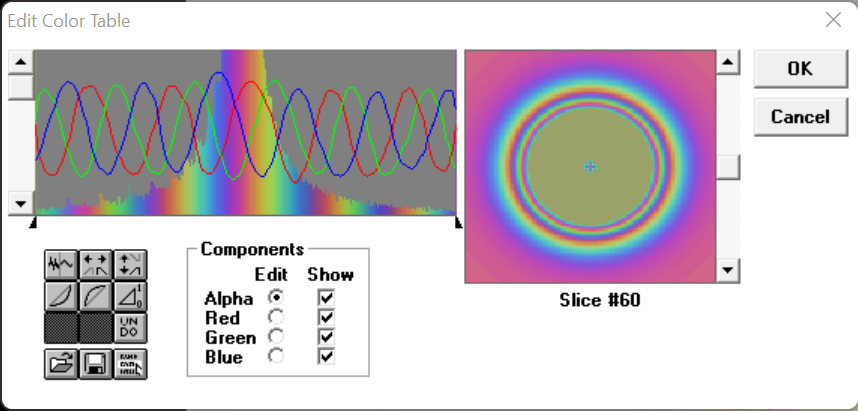
This was my first attempt at a repeating rainbow. The repeating waves is what causes the bands. They have to be staggared however, to make a rainbow, otherwise it will be grey.
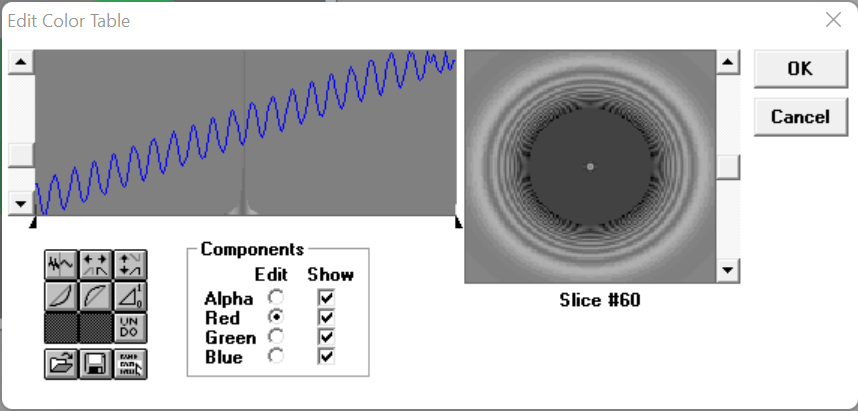
That rainbow was actually an edit of this banded grey color table! Under the blue wave is also a red and a green wave, and I used the buttons to move them around so that they were not perfectly overlapping.
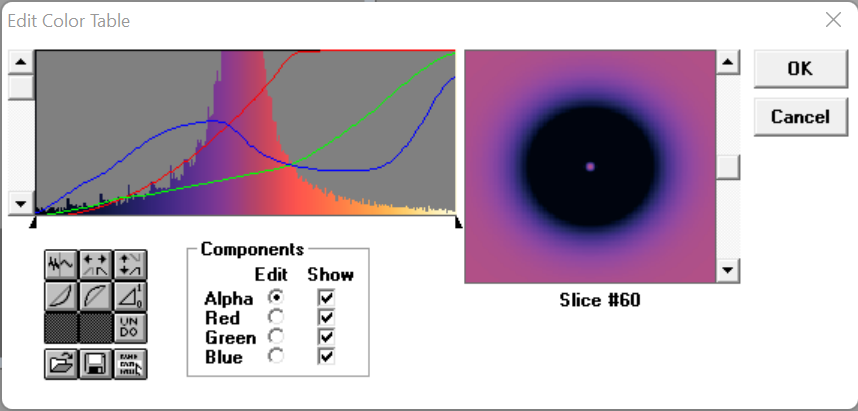
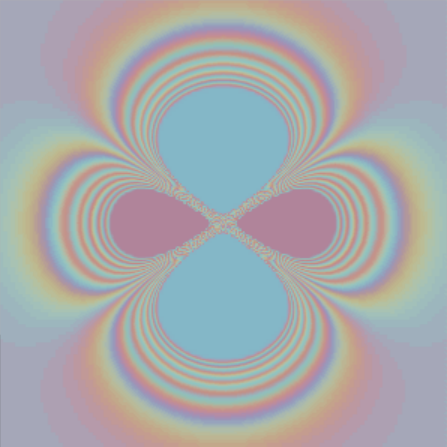
This is a more simple color table, likely prettier with a different model.
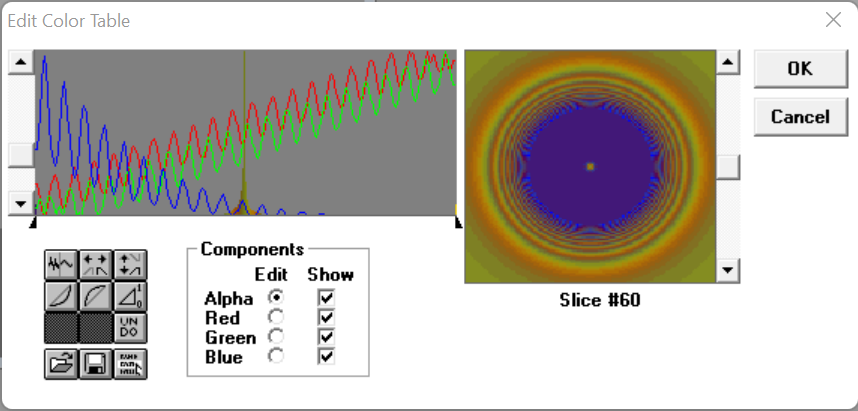
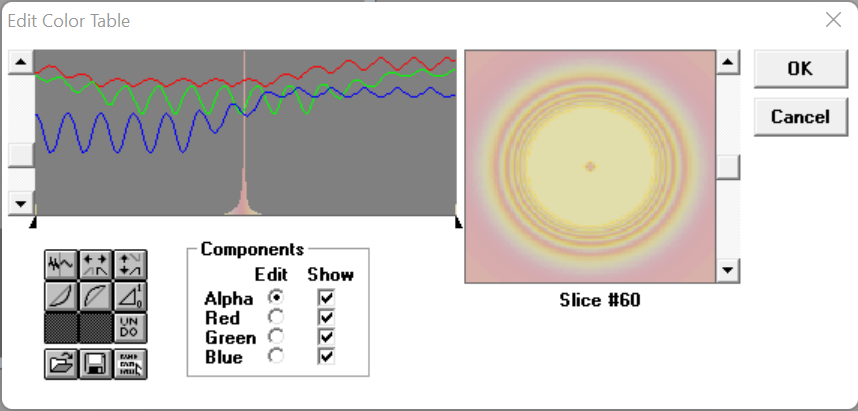
This one is very similar to my original rainbow, but with the blue lowered down so that the yellow is more saturated.
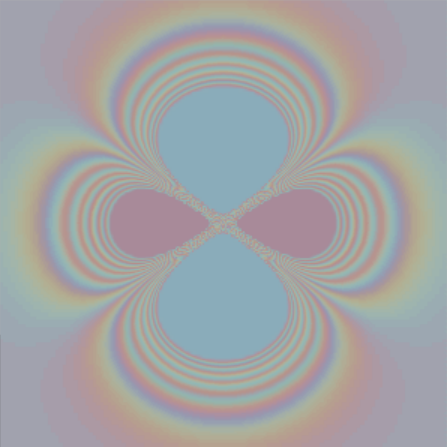
Still experimenting with the premade waves. Their biggest draw back is that they are diagonal, andI could not get them to be straight while also keeping the waves the same height. I was pleased, however, that the min and max colors werent as saturated as they were in my previous rainbow attempts. I didn't realize at the time, in order for them to be grey, that I would have to edit the waves so that the begining and end of each one started/ended at the same height.
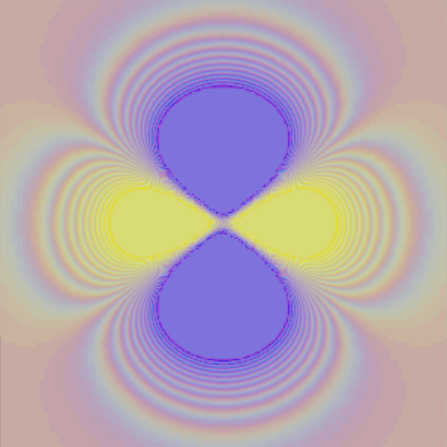
I resorted to drawing my own waves; difficult with a mouse, but I had a touchscreen laptop at the time. I drew one wave first, and in order to make sure they were evenly spaced and the same height, I drew the other colors ontop of that wave, then use thed buttons to move them to be staggered.
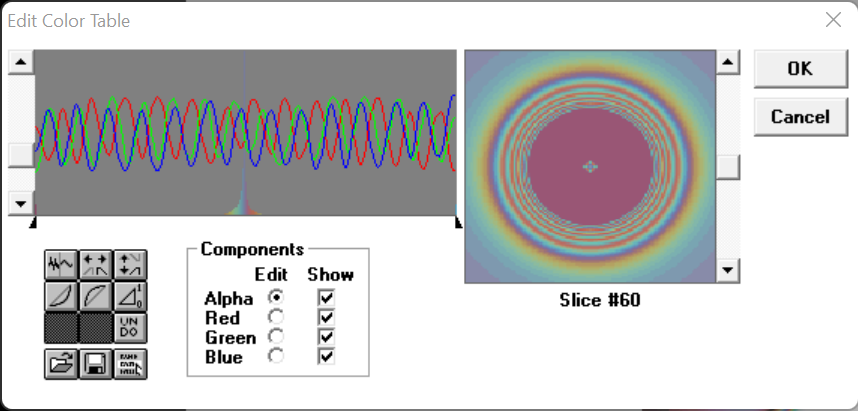
Similar idea, but with more waves, so there are more rainbow bands
My fixation on this cosmetic part of an old 3D modeling program was not what my physical chemistry professor wanted me to get out of modeling the spheres and orbitals, but here I am! If you've made it all the way down here I'm astounded. If you've downloaded slicer and played with it I'm touched! Let me know in my guestbook if you have ^^